Profiling is one of the most reliable techniques in the arsenal of a software engineer when debugging performance-related issues. And yet, profiling large distributed systems like Flink can still be extremely challenging.
JVM Tools
JVM comes with a variety of profiling tools, Flink documentation covers some of them. However, this approach has a few downsides:
- these tools usually require enabling/disabling different JVM flags. Keeping them enabled for a long periods of time is undesirable, since they can affect performance.
- which means a JVM restart is needed, and that can be very inconvenient - some regressions are not easily reproducible and it can take a while to get the system in a failure state again.
Flink Flame Graphs
Flink introduced built-in flame graph support in version 1.13. It’s a very cool feature, but unfortunately, it’s quite limited:
- it’s still considered an experimental feature and it’s disabled by default.
- it only supports JVM runtime (no system calls).
- in my opinion, the UI/UX is a bit clunky and challenging to use.
async-profiler
async-profiler is an amazing, lightweight JVM profiler that doesn’t have any of the downsides mentioned above. It can be executed anytime, doesn’t require any additional JVM flags, supports system calls, doesn’t introduce much performance overhead and, finally, can generate amazing flame graphs!
It can be easily added and executed in a running Flink Docker container - it doesn’t even need root access.
So, to start, simply connect to a running TaskManager (e.g. with kubectl exec) and execute:
1wget https://github.com/async-profiler/async-profiler/releases/download/v2.9/async-profiler-2.9-linux-x64.tar.gz
2tar -zxvf async-profiler-2.9-linux-x64.tar.gz
3cd async-profiler-2.9-linux-x64
4./profiler.sh -d 60 -f /tmp/flamegraph.html 1
Here we download and unpack the async-profiler’s archive and run it. Alternatively, instead of downloading and unpacking it every time, you can just add it to your Flink’s Dockerfile or other similar build script.
The last command may need an explanation:
-d 60sets the profiling time (one minute is usually enough).-f /tmp/flamegraph.htmltells it to capture the result as a flame graph file.1is the PID of the running Flink process. Typically should be1, but if it’s not the case you can find it by runningps ax.
After it’s finished the flame graph html file can be copied locally, e.g. with kubectl cp.
Generated files support search and drill-down functionality.
Just Use It!
See an operator in your Flink topology that’s 100% busy? Run profiler. Think that’s a new version of a pipeline slower than the old one? Run profiler. Pretty sure that the pipeline is supposed to have a higher throughput? RUN PROFILER!
Examples of Analyzing Flame Graphs
Instead of a summary, here are a few Flink flame graphs I collected over the last year.
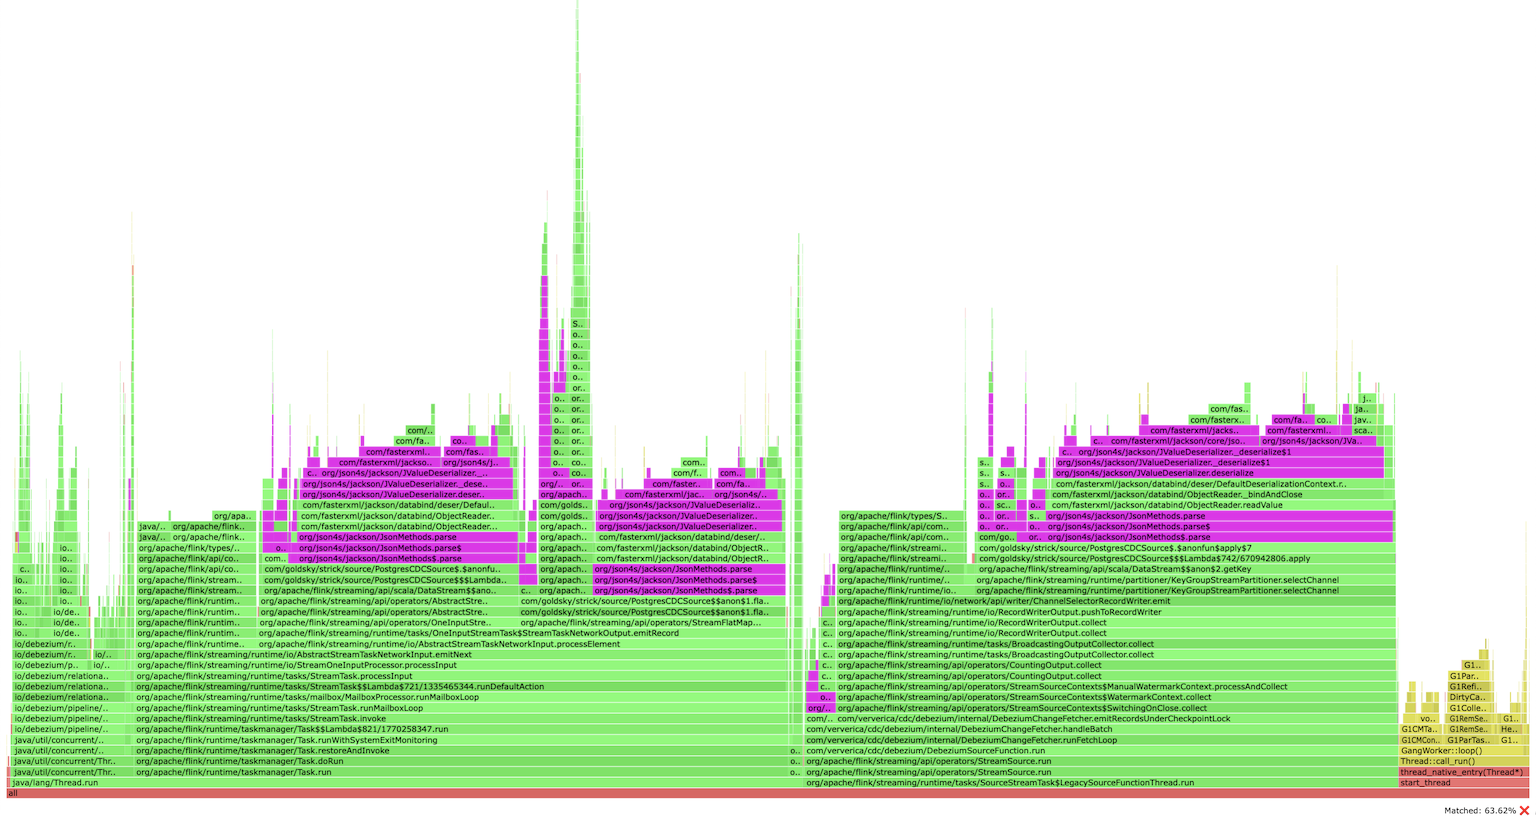
Profiling a Flink CDC application found a bottleneck in JSON serialization/deserialization (simply searching for json):
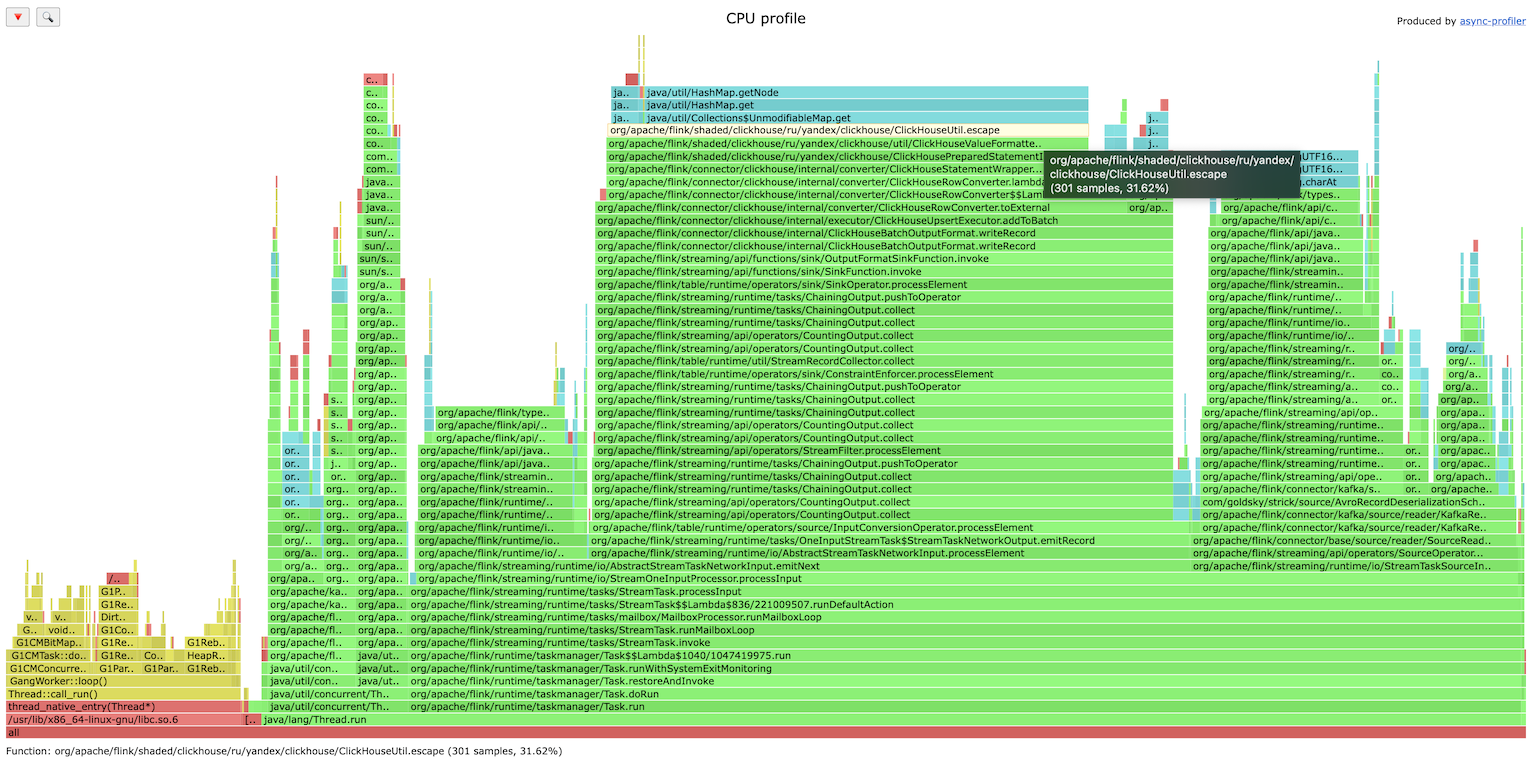
ClickHouse Flink connector is bottlenecked on string escaping (fixed in later versions):
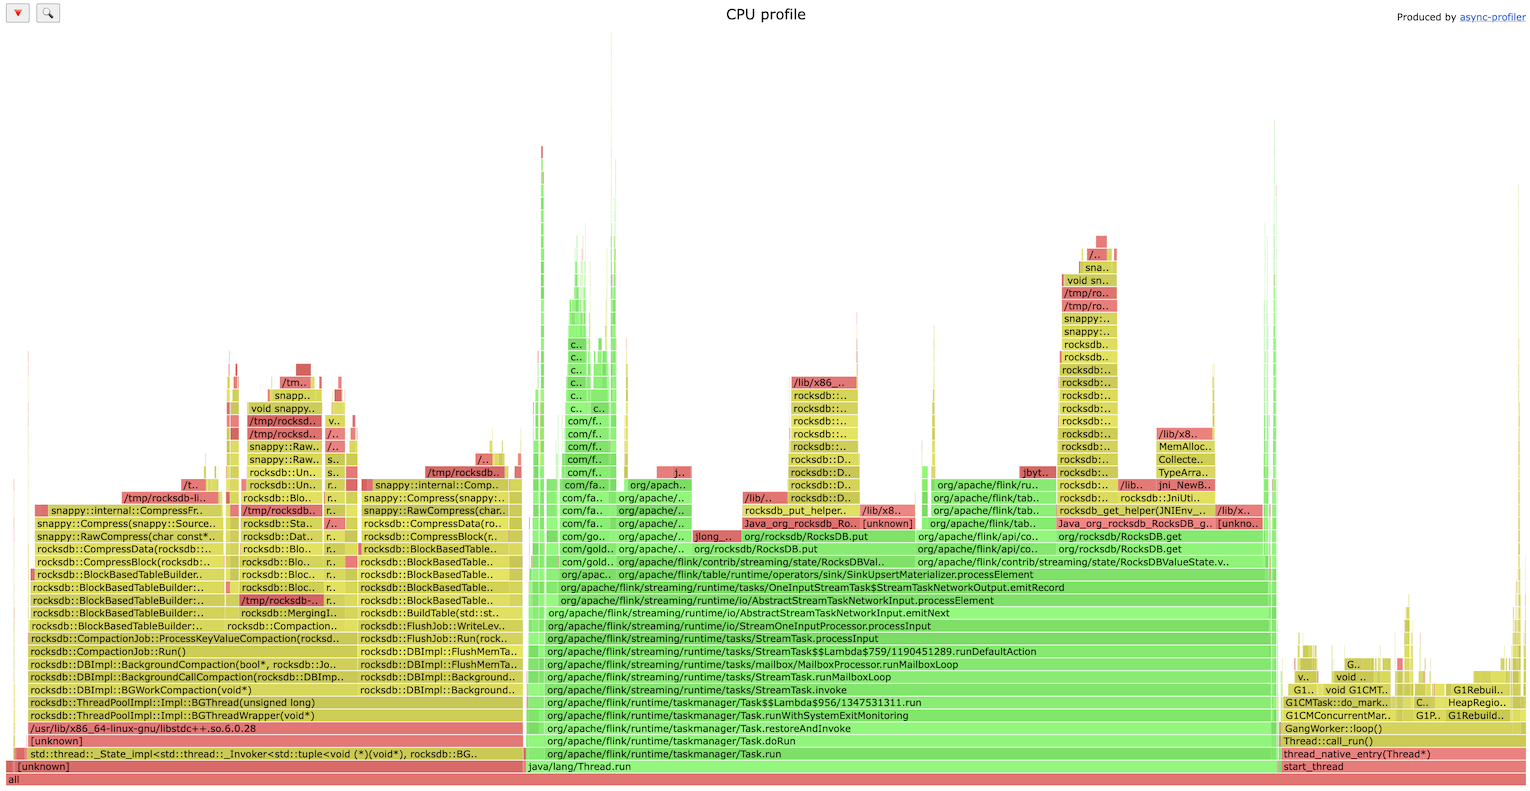
RocksDB IO as a bottleneck, very common issue (the investigation showed that SSD wasn’t used):